drush rebuild sitemaps
drush ssg
https://freida-admin.lndo.site/admin/config/people/saml/authmap?authnam…
Under links delete the link for the user you want to login with at /user
if it still won't log you in delete your cookies for that domain.
Check that the containers are in fact in orbstack, and make sure orbstack is still set as the default and not docker:
# check which is the default orbstack or docker
docker context ls
# Switch to OrbStack context
docker context use orbstack
# Verify it switched docker context ls
lando power off
lando start
drush uli --name=username
Here are two examples of using json search API https://www.drupal.org/project/jsonapi_search_api
json search api also lets you search http://freida-admin.lndo.site/api/index/searchstax_jlb_index?filter[ful…
or
http://freida-admin.lndo.site/api/index/searchstax_jlb_index?filter[fie…
drush search-api:index searchstax_jlb_index
where searchstax_jlb_index is your index name, searchstax_jlb_index is mine obv.
and then to clear the index
drush search-api:clear my_index
Don't just delete / remove what's in your vendor directory, you can delete composer.lock and the entire vendor directory (the directory also) then run composer install again, to regenerate all the packages again.

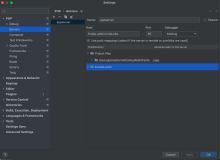
Once you put in the xdebug on and off into .lando.yml you can use the path mappings in the attached screenshot to get the debugger working in phpstorm. I needed to setup these pathmappings to get it working.
excerpt from my working .lando.yml