These directions worked with some modifications: https://javorszky.co.uk/2018/05/03/getting-xdebug-working-on-php-7-2-an…
I was using PHP on the command line with homebrew, so installed xdebug with pecl install xdebug
then I was able to put the following in the php.ini file, find the php.ini file for the command line by running php --ini and look for Loaded Configuration File in the output.
The below is for XDEUG 3.0
[xdebug]
zend_extension="/opt/homebrew/Cellar/php@7.4/7.4.16/pecl/20190902/xdebug.so"
xdebug.mode=debug
xdebug.client_host=127.0.0.1
xdebug.client_port=9000
xdebug.start_with_request=yes
xdebug.output_dir="/Applications/MAMP/tmp"
xdebug.log="/Users/jbarnett/xdebug.log"
xdebug.idekey=PHPSTORM
Just got this working with lando and phpstorm
I had to add this to my .lando.yml
services:
  appserver:
    config:
      php: config/php.ini
    environment:
      PHP_IDE_CONFIG: "serverName=appserver"
and in my config/php.ini I added
xdebug.start_with_request=yes
xdebug.idekey=PHPSTORM
xdebug.client_port=9000
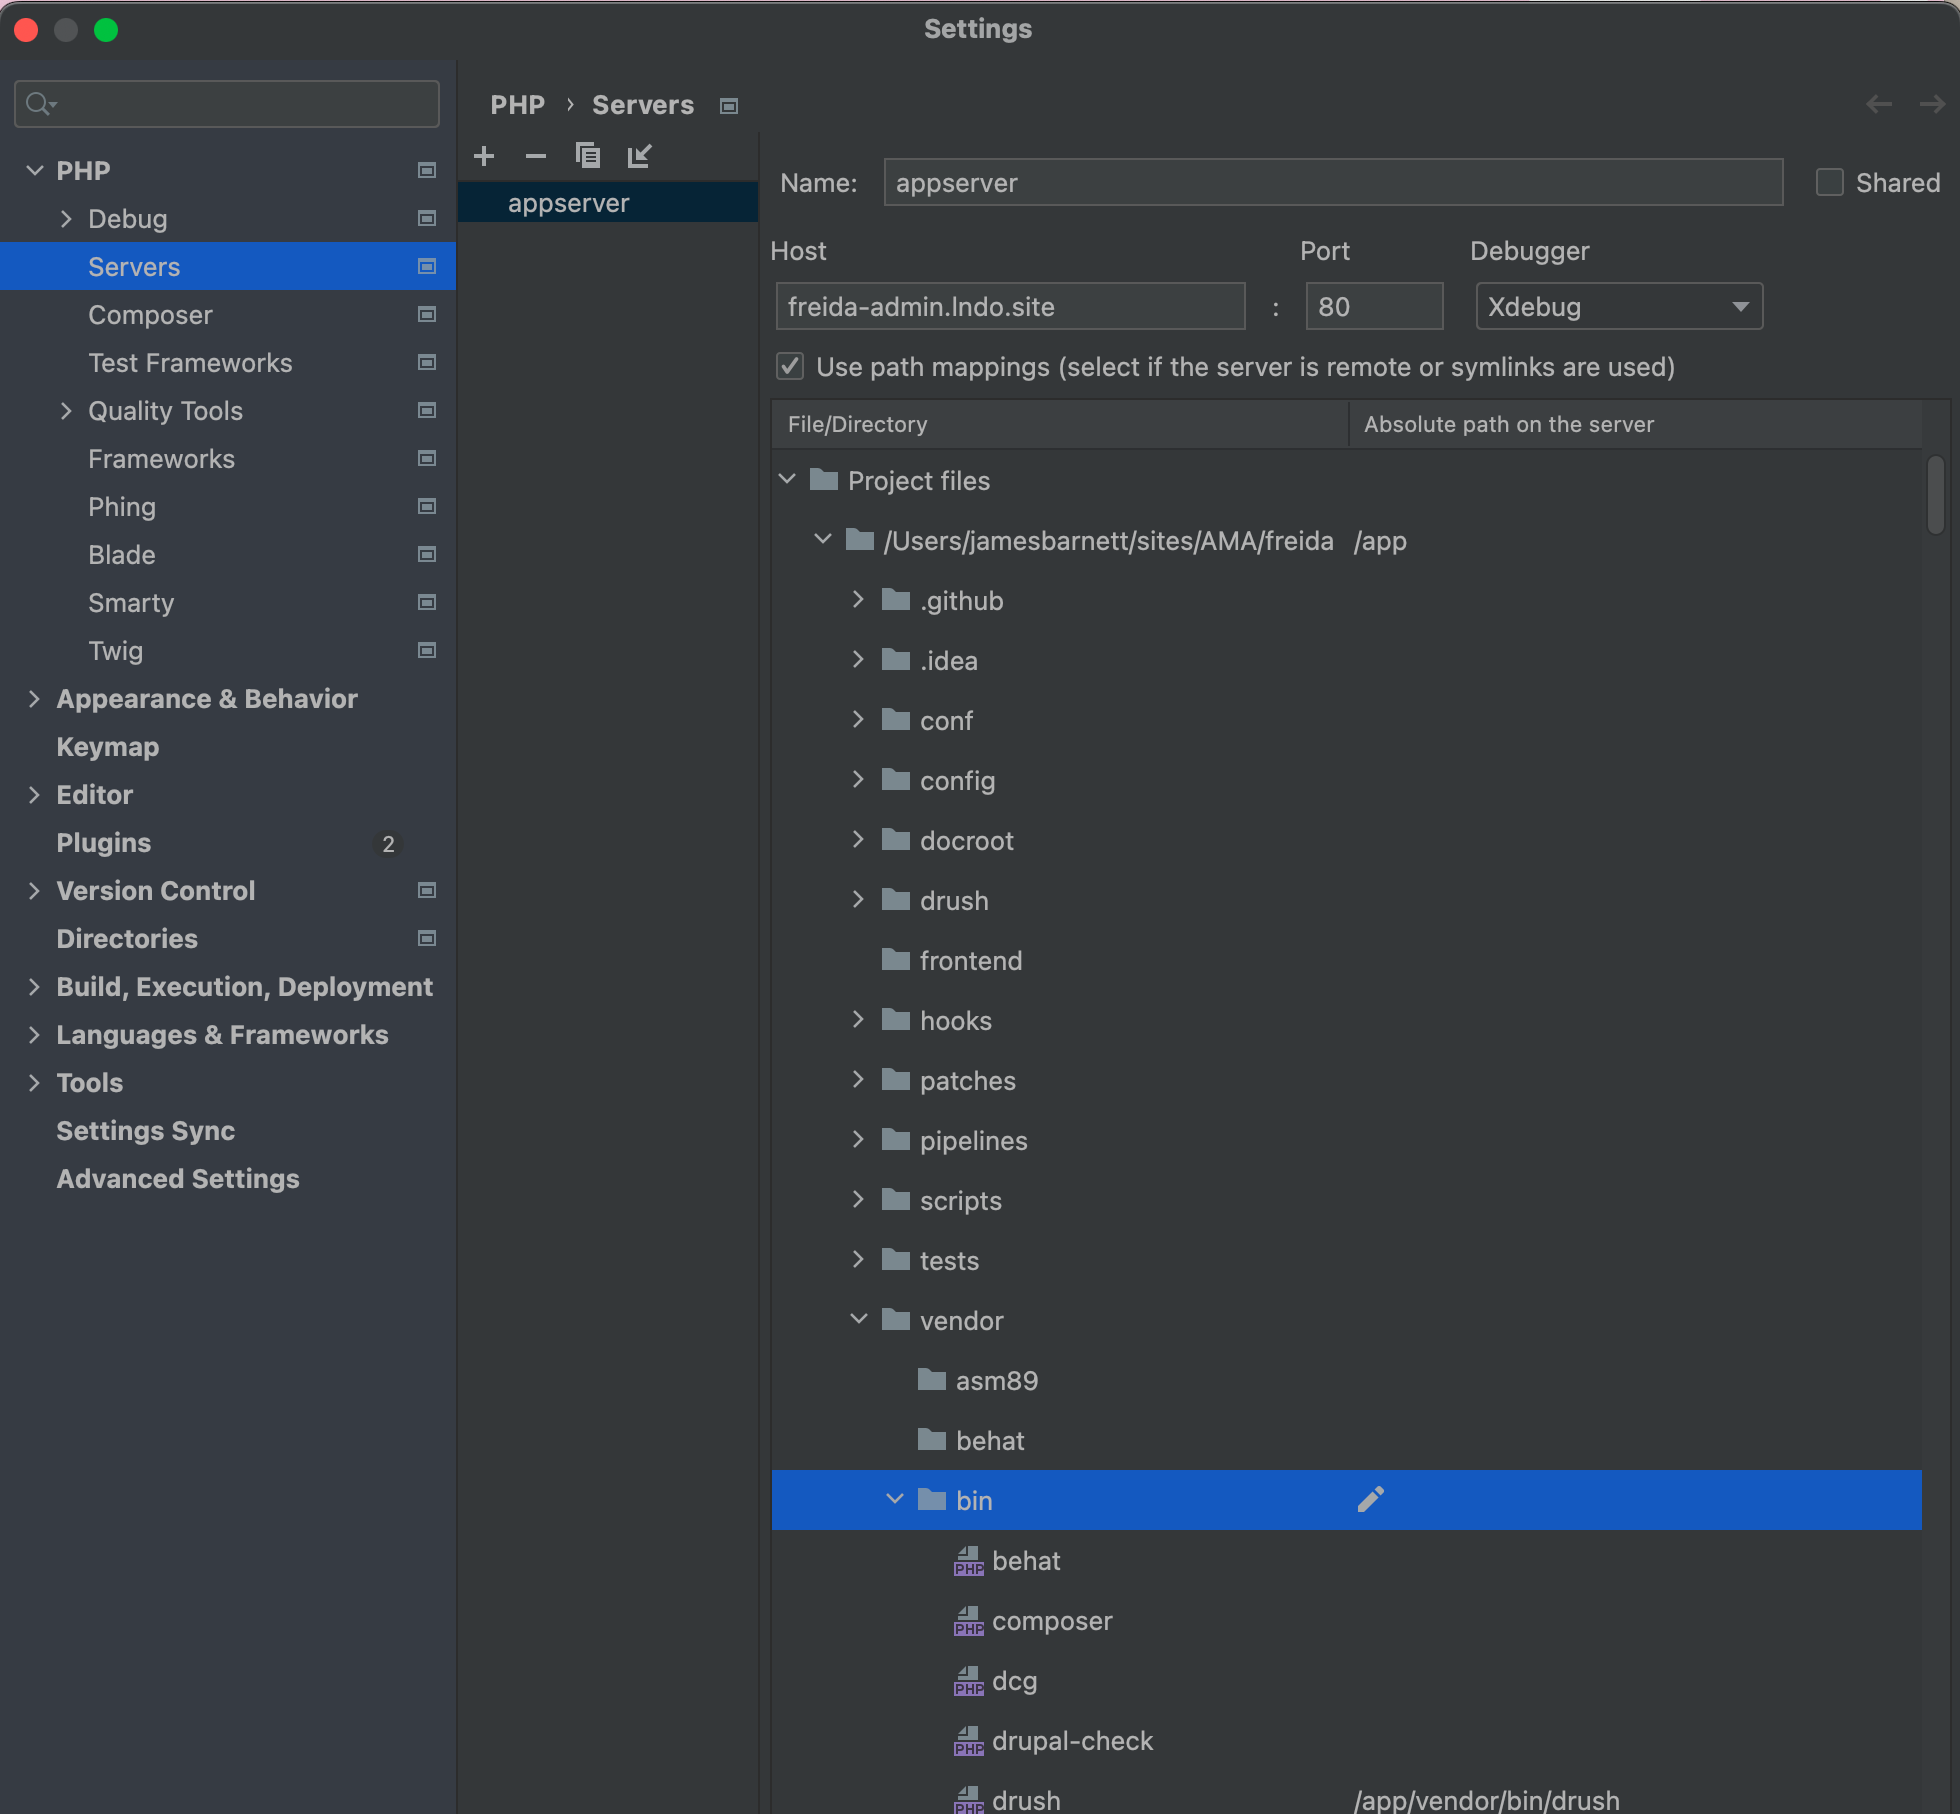
I also have a server under phpstorm PHP->servers called appserver and I map /Users/myusername/sites/AMA/freida to /app
host is freida.lndo.site port 80 debugger xdebug
and within that mapping I also explicitly mapped vendor/bin/drush to /app/vendor/bin/drush

